





Bitcoin has fallen more than 3% in the past 24 hours, sliding from around $77,880 to nearly $75,220 as geopolitical tensions in the Middle East, institutional outflows, and persistent supply pressure weighed on market sentiment.
According to CoinGecko data, Bitcoin traded near $75,500 during early Asian hours on May 27 after briefly losing the $75,000 level overnight.
Bitcoin has pulled back just days after it rallied toward $82,000 on May 12, a move that failed to sustain momentum as sellers returned near key resistance zones.
Fresh middle east escalation stirs fear
Fresh geopolitical risks added to the pressure across crypto markets. Overnight, the US Central Command launched airstrikes on targets in southern Iran near the Strait of Hormuz, according to US military officials.
The strikes followed Iran’s rollout of “Hormuz Safe,” a Bitcoin-denominated maritime insurance system designed to facilitate shipping transactions outside traditional banking rails.
The US Office of Foreign Assets Control warned that the platform could violate international sanctions, while Iranian officials threatened retaliation after the strikes.
Concerns around possible escalation near one of the world’s most important energy corridors pushed investors toward traditional safe-haven assets such as gold, reducing appetite for volatile assets, including cryptocurrencies.
At the same time, tensions between Israel and Lebanon intensified after the collapse of a temporary ceasefire extension brokered earlier this month. Israeli Prime Minister Benjamin Netanyahu ordered expanded military operations in southern Lebanon, while airstrikes in Nabatieh and the Bekaa Valley reportedly killed multiple people following evacuation warnings.
Israeli cabinet ministers have also publicly discussed widening operations toward Beirut amid continued Hezbollah drone activity near the border.
Oil prices moved higher alongside the regional escalation, reviving concerns about inflation after hotter-than-expected US CPI and PPI readings earlier this month.
Expectations that the Federal Reserve could keep interest rates elevated for longer continued to pressure liquidity-sensitive assets, including Bitcoin.
Supply pressure continues to cap Bitcoin rallies
Alongside the macro and geopolitical backdrop, analysts say older Bitcoin holders continue to add supply into rallies.
Alex Thorn, head of research at Galaxy Digital, said coins from previous market cycles have consistently moved since the Oct. 10, 2025, flash crash.
Data compiled by Thorn showed that nearly half of the supply activated during the past seven months came from wallets that last moved BTC when Bitcoin traded above $103,600.

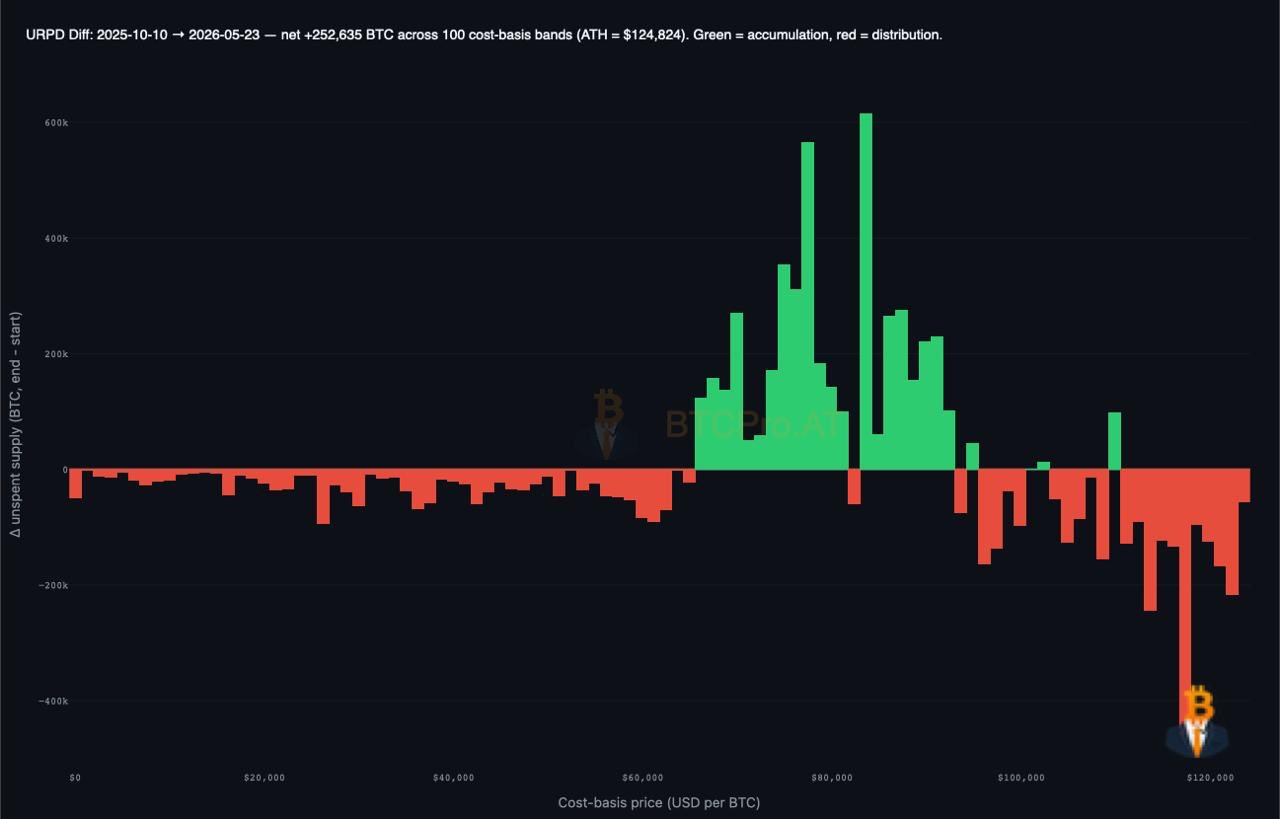
Bitcoin net supply change by cost basis (oct 2025 – may 2026). Source: Alex Thorn on X.
According to Thorn, around 4.45 million BTC likely changed hands during that period, leaving a substantial supply concentrated near the current trading range around $77,000.
He added that 36% of the Bitcoin moved since October came from holders with a cost basis below $66,000, including roughly 237,000 BTC dormant since before the FTX collapse in November 2022.
Thorn said the market still has “a lot of supply to absorb” near current levels, making breakouts harder while previous-cycle holders continue taking profit or exiting positions.
Against this backdrop, institutional flows have also weakened, with spot Bitcoin ETFs recording persistent net outflows in recent sessions.
Further, Thorn highlighted a $1.29 billion block trade tied to BlackRock’s iShares Bitcoin Trust ETF earlier this month, which, according to the analyst, may suggest some institutional investors are reducing exposure while Bitcoin remains far below its all-time high.
As of publication time, the Crypto Fear and Greed Index had dropped to 37, placing investor sentiment firmly in “Fear” territory.
Bitcoin price analysis
On the technical side, Bitcoin remains trapped below its descending 200-day moving average near $80,100 on the daily chart, a level that has repeatedly rejected recent recovery attempts.

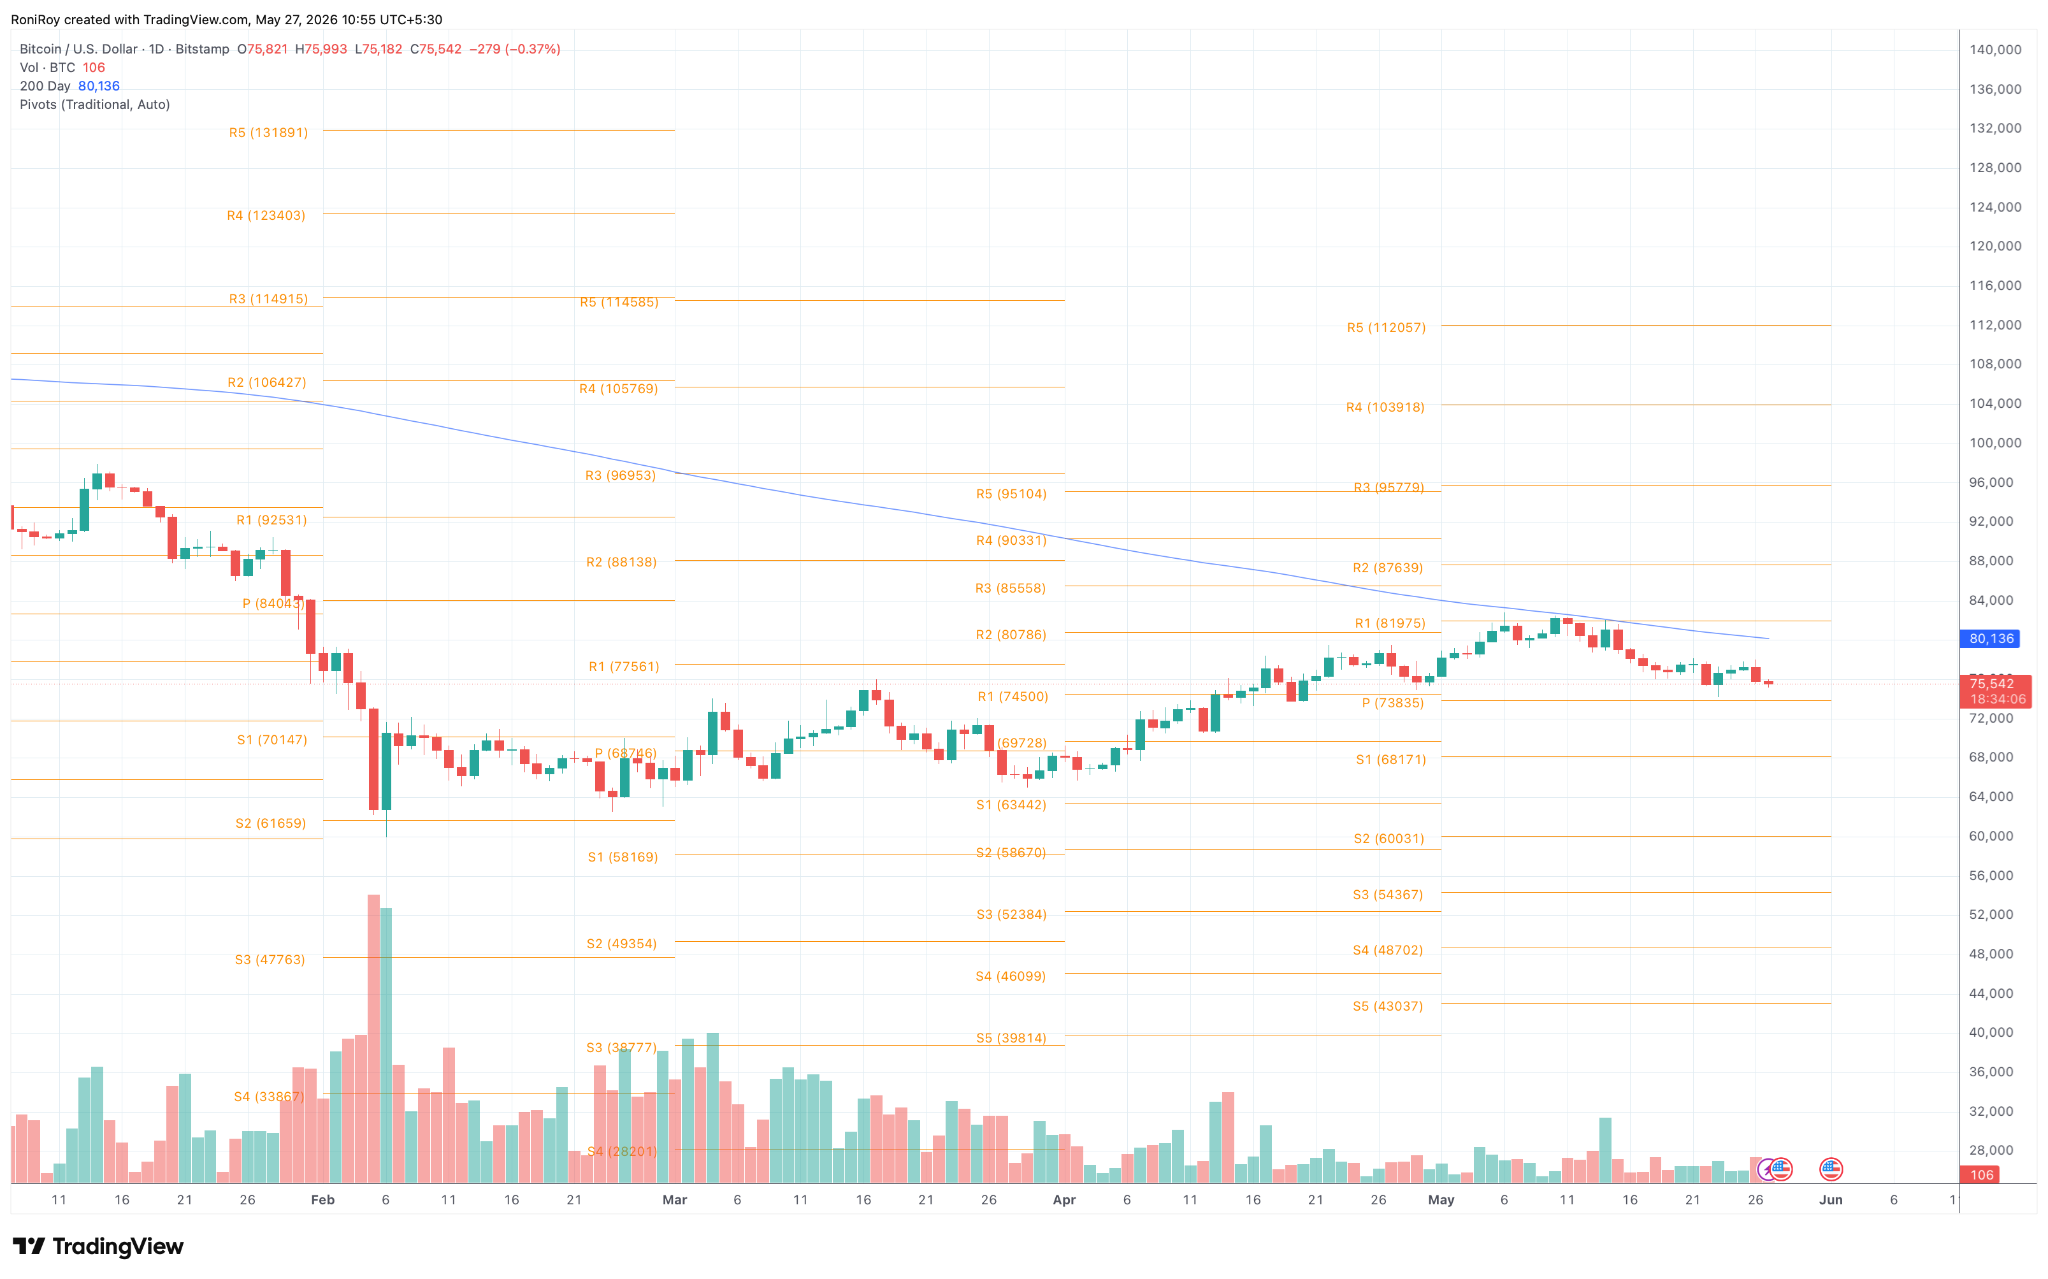
BTC/USD 1-day price chart. Source: TradingView.
The BTC/USD 1-day price chart confirms that Bitcoin has struggled to reclaim the $77,000 to $78,000 range after losing momentum near the descending resistance trendline earlier this month.
Daily candles have also continued printing lower highs since the May 12 rejection near $82,000.
Immediate support now sits near the $73,700 zone, which aligns with a key pivot area visible on the daily timeframe.
A break below that region could expose Bitcoin to another move toward the $68,700 and $64,300 support levels seen during previous consolidation phases.
For bullish momentum to regain control, buyers would likely need to reclaim the $82,000 to $84,500 resistance range, where repeated sell pressure has capped upside during the past several weeks.
The post Why is Bitcoin tumbling below key levels today? appeared first on Invezz